Showing posts with label Demography. Show all posts

Monday 26 April 2010

2011 – a political census

Next year will be a big year politically – there will be elections for the Assembly, and probably also for the district councils (though it is still uncertain which councils). But 2011 will be significant also demographically, because it will see the next decennial census, on Sunday 27 March 2011.

The census, although nominally apolitical, is a highly political exercise in Northern Ireland – and next year will take the level of politicisation to higher levels.

The 2001 census added to the usual question on religion one on 'religion or religion brought up in', in an attempt to label those who claimed no current religion. This nuance seemed to add considerably to the picture of Northern Ireland's population (though NISRA used some slightly questionable methodologies to 'allocate' those who resisted allocation). The question on 'religion or religion brought up in' will be retained in 2011, allowing demographers to draw some very broad conclusions – and of particular interest will be the 'evolution' of the very young, who had a high rate of non-declaration on the religious question, despite a lower rate amongst their parents (who actually filled in the forms on their behalf!). It will be interesting to see if the 7.4 % of 0-4 year-olds in 2001 with no 'religion or religion brought up in' have grown up to be an equally irreligious group of 10-14 year-olds.

The Proposals for the 2011 Census of Population in Northern Ireland, published in March by NISRA, add several novelties that were not included in 2001, including questions on:
  • Citizenship
  • National identity
  • Main language
  • Ability in English
  • Ability in Irish and Ulster Scots
While these questions may have rational justifications in terms of service provision by government departments, there is no question that in the Northern Irish context they are political questions.

The question on 'national identity' is separate to that on citizenship, and is thus a wholly political question, designed to show what proportion of the population considers themselves 'Irish' or 'British'. It is not clear yet what permutations of answers will be allowed, or if it will be a free-text field. The possibilities include, of course, Irish, British, Northern Irish, 'Ulster', or any combination of these (not counting those people who identify with countries further afield). The results of this question will, of course, be argued over for years – with unionists claiming that 'only X % of the population identify themselves as Irish, and therefore Irish unity is a non-starter', etc. Others may point out the the 'Irish' identity outnumbers the 'British' identity west of the Bann and that re-partition should be considered. Still others will look at the evolution of identities across age groups – if more of the young see themselves as 'Irish' than 'British' then the future if Northern Ireland comes into question.

The questions on ability in Irish and/or Ulster Scots will, no doubt, be used to provide unionists with a weapon to use against an Irish Language Act, and probably also to argue against funding for Irish in general. The 'main language' of 99.8 % of the indigenous population will turn out to be English, and this will, of course, be used against any 'concessions' to the Irish language.

Censuses do not give up their results overnight like elections, of course, and thus while 2011 may provide political shocks at Assembly and Council levels, the census will dribble out its results over a longer period, and influence political discourse for a number of years. It will provide enormous amounts of data for politicians and demographers to pore over, and to argue over. But at the end of the day the most important factor in political decision-making remains election results. No matter what the census tells us about national identity, if a majority of voters vote for nationalist parties, this trumps the census. For that reason, while the political census next year is interesting, the elections will be vital.

Saturday 24 April 2010

Et tu, Fionnuala?

In Fionnuala O’Connor’s Constituency Profile on South Belfast in today’s Irish Times:

“The last census showed South Belfast still had a unionist majority …”

Focal sa chluais, a Fhionnuala – the census does not measure political persuasion. In fact there are no ‘political’ questions whatsoever in it. What it measured was religious persuasion. What you wished to say, no doubt, was that the census showed that South Belfast had a Protestant majority (around 52%). In polite company it is normal to pretend that there is no direct correlation between religion and politics – but privately many people know there is.

And clearly so does Fionnuala O’Connor and the Irish Times.

Friday 16 April 2010

It's still all about Irish unity

Just in case some unionists have gotten the wrong end of the stick – particularly about John Hume's 'post nationalist' nonsense – or have actually believed their own propaganda about Sinn Féin having 'surrendered' – the two nationalist parties have just reminded them that, for both Sinn Féin and the SDLP, the ultimate goal remains Irish unity.

Margaret Ritchie, launching the SDLP election campaign said:

"So let me spell it out loud and clear: Our job is nowhere near completed:

Yes we secured Civil Rights and Equality; We got the IRA to see the futility of its campaign and yes we got everyone to see that a powersharing devolved Government was essential. All basic SDLP objectives – all delivered.

But we are now targeting the next set of fundamentals which affect peoples lives. We are going to set the political agenda for the next generation by focusing on creating prosperity, building a Shared Future and planning, credibly, for Irish Unity"

"The SDLP believes in a United Ireland. Unambiguously.

We will work every day to lay the foundations upon which a United Ireland can be built – mutual trust, respect and protection for minorities.

We will take our unique ideas for achieving unity to the heart of decision-making in Dublin and London. We will press every party in Westminster to engage around the SDLP’s radical thinking on unity and our work will present people with the first detailed view of what Unity would look like - ever produced.

Further, we will not promise something unrealistic like Irish Unity by 2016, simply because it is the anniversary of the Easter Rising! Unlike others, we will be credible on Irish Unity."

Gerry Adams, also launching his party's election campaign yesterday, said:
"Sinn Féin is the united Ireland party. The all-Ireland party. The party with elected representatives in every forum on this island. From Cork to Derry, from Kerry to Down people vote Sinn Féin.

We are in the business of nation building. As Irish republicans we have put the issue of Irish re-unification onto the political agenda in London, Dublin, Washington and Belfast. We have engaged the Diaspora across the world in the campaign for a united Ireland.

We are also engaging with unionists on this issue at civic and community, as well as political level, and on social and economic, on bread and butter issues, as well as on the constitutional question.

Our vision for a united Ireland is unique amongst the parties in this election."

So when the votes are counted, on May 7 unionism should look closely at the combined nationalist score – because this represents the proportion of the electorate who 'unambiguously' support Irish reunification. If the proportion of the electorate that supports the two nationalist parties has increased from that of 2005 (41.8%, though without Kieran Deeny this would have been at least 1% higher) or 2001 (42.7%), then it is time to start worrying.

The nationalist proportion of the vote in Westminster elections has been increasing fairly steadily for a generation, and is getting closer to parity with unionism. Unionism, so long the 'majority community' is very close to simply having a plurality – and ultimately a minority. As the elderly – predominantly Protestant – die, and as the young – majority Catholic – start to vote, the gap will continue to close.

So, unionism – read their lips. It's all about Irish unity. And it's getting closer.

Tuesday 13 April 2010

Connor poses a long-term risk for nationalism

The agreement by the DUP and UCUNF to withdraw their candidates in Fermanagh and South Tyrone in favour of a 'unionist unity' candidate poses long-term challenges for nationalists in the constituency.

Unionists in the constituency, despite having proved that David Cameron is a liar, will be ecstatic about the outcome, which is an almost certain win for them. The Tories, despite having to mumble half-excuses about how "Fermanagh and South Tyrone has characteristics that are unique within the UK" will, at the end of the day, probably have another vote to count on in Westminster – and that is all they really care about. The DUP have eaten the most humble pie, though. Despite being the largest unionist party in the constituency in recent elections, they have had to stand aside for a man who will lend his support to their opponents. Whether the 'recapture' of the seat for unionism as a result of their pressure for a pact will adequately compensate them, we may have to wait another year to see.

The 'unionist unity' candidate, Rodney Connor, is himself part of the problem for nationalism. He is apparently a decent man and quite well thought of by nationalists in the area. How strong his unionism is, is open to question – the unionist parties think that he is 'one of theirs', but he has joined neither party, and insists that he will act in the interests of the whole constituency. Given that that constituency is majority nationalist, it will be interesting to see how he does that.

But potentially more damaging for nationalism will be the loss of the constituency. History shows us that when the seat is held by a nationalist – especially a 'nationalist unity' individual like Frank Maguire (MP from 1974-1981) – the nationalist vote is high, but when a unionist wins the seat – usually as a result of a split nationalist vote – it seems that some nationalists withdraw from voting. After Ken Maginnis won the seat in 1983 thanks to the decision by the SDLP to stand again, the number of nationalist votes tumbled. Maginnis retained the seat thanks to his role as 'unionist unity' candidate in 1986, 1987, 1992 and 1997. In all of these elections both Sinn Féin and the SDLP stood, and nationalists knew that they could not win the seat. The nationalist vote dropped as a significant proportion simply didn't bother to turn out.

Although the constituency lost the heavily nationalist Coalisland area to Mid Ulster in the 1995 boundary revision, and FST became a more evenly split constituency, it remained winnable for nationalism. The result in 2001, when Sinn Féin finally took the seat, thanks to a split in unionism – proved that there were more latent nationalist votes in the constituency than unionist votes. They had just failed to turn out between 1986 and 1997.

And therein lies the problem for nationalism. Faced with a 'unionist unity' candidate and a nationalist split, many voters may again fail to turn out. If Connor wins, subsequent Westminster elections may see the effects of nationalist demoralisation in the constituency, and this could last a decade or more. FST contains a significant number of hard-line republicans who are probably less inclined towards 'constitutional politics' than others, and they are more likely to withdraw from active participation if they feel that it is a waste of time, with a 'unionist unity' victory inevitable.

So Connor has the possibility of not just taking the seat in 2010, but retaining it with increasing majorities for years to come. Only when nationalism senses that it has a good chance of winning, either through a 'nationalist unity' candidate, or a unionist split, will it return to the ballot box in force. The lessons that unionism will draw from the Connor experience are that they must never again split their vote in FST, so nationalism has only three possible hopes in the constituency: either a unity candidate in the short term, or the decimation of one of the nationalist parties, or the slow option of waiting for demography to whittle away the unionist numbers.

The first option – a unity candidate, is not likely in 2010, and barely likely even at the next election. The mutual dislike between Sinn Féin and the SDLP is such that neither would happily give way to the other. The best option in this case would be a 'non-political' unity candidate – someone popular through sport or the media, for example. Fearghal McKinney may have been such a man, but he was seduced by the SDLP's pointless lure.

The second option – the decimation of the SDLP – seemed quite likely in recent years, but the SDLP has made efforts to revive itself, and certainly is not out of the race yet. If it fails badly on May 6, either in terms of votes or seats, its days may be numbered – but that will be too late for FST this time.

The last option - demographics - though slow, is more certain. The graph above shows the number of actual votes received by unionism and nationalism in Westminster elections in FST since 1970. The nationalist number is quite volatile, and includes a decade of demoralised underperformance. The unionist number, however, is less volatile and more consistent. And it is consistently declining – the trend is clearly downward, reflecting Protestant demographics in the constituency. In brief, Protestants are a declining proportion of the constituency's population – from over 50% of the population amongst those aged over 60 (in the 2001 Census) (on the right hand side of the graph), to below 40% of those aged 25 and younger (in the 2001 Census) (on the left hand side of the graph):

So it is likely that demographics will return FST to nationalism in the future, if Connor takes it in 2010. But a quicker and better route would be for nationalism to play unionism at their own game – unity – and beat them.

Friday 2 April 2010

Deaths in 2009

The statistics on deaths in 2009, published by NISRA on 25 March 2010, are remarkable only in one respect. The death rate has gone down again, and is now at its lowest ever point. What this means, quite simply, is that proportionately fewer people are dying – on the contrary they are living, and for longer and longer.

As a consequence a greater proportion of deaths – 31% in 2009 – are to the very elderly, those aged over 85.

What this means in political terms is, as yet, unexplored. It is a known fact that the Protestant (and thus unionist) proportion of the population rises with age. Of those aged over 85, for example, over 67% are of Protestant community background (according to the 2001 census, when, as mere 76-year-olds they thus declared themselves). Their grandchildren (those aged 20 in 2001) represent only 47% of their age cohort!

So clearly the elderly are more unionist than the young, and research tells us that older voters are more likely to vote than younger voters. But there is no research on the voting habits of the extremely elderly. People in relatively good health are likely to vote, but what of the bed-ridden, extremely infirm and those suffering from dementia?

There may be a peak of electoral turnout somewhere around the age of 70 – and thereafter a drop off. Common sense would suggest this, but no research has been done to demonstrate it.

Unionism obviously is enjoying a windfall from longevity, but if it turns out that the turnout rate for the extremely elderly is lower than that of those slightly younger, then that windfall may not be as valuable as it seems. Since unionism does appear, in recent elections, to be getting a smaller proportion of the vote than the Protestant proportion of the electorate, then perhaps the effect of the elderly may already be visible. Unionist politicians like to imagine that there is a ‘reserve army’ of ‘garden centre Prods’ who will come to their assistance if ever their precious union is threatened – but maybe those missing Protestant voters are not in the garden centre. Maybe they’re in the old folks homes and the hospices.

Friday 26 March 2010

North-South divergence on births

The Central Statistics Office (CSO) yesterday published its bulletin on vital statistics for the third quarter of 2009 (in the south), and it shows some differences between the north and the south.

The figures for 2009 for the north, published by NISRA on 18 March show that the birth rate (the number of babies per 1000 of the population) was 13.9 – and this represented a slight decrease from 2008. In the south, by contrast, the birth rate was a whopping 17.3 – an increase from the previous year, and by far the highest rate in the EU.

In fact, the birth rate in the south is usually higher than the north, and they tend to move in roughly the same direction:

In 2009, though, they moved in different directions, and a considerable gap has thereby opened up.

Reasons for this divergence are not obvious. The increasing birth rate in the south, as in the north, can be partly ascribed to the influx of young migrants since the opening up of both labour markets to A8 workers in 2004. This has had the effect of lowering the average age in the population, but more importantly, of adding a large group of people of prime child-bearing age to the population. So far, so obvious – the number of births increases, and the birthrate increases with it. But why did this change in 2009? Babies born in 2009 would probably represent decisions taken nine months earlier – thus usually in 2008, when times were not so bad (compared with now). Were expectations in the north in 2008 worse than in the south?

This scenario is not borne out by the evidence of the labour market – unemployment rates in the north did not deteriorate compared with the south in 2008-9. So why did people continue to have babies in the south, but hold back in the north? These questions cannot be easily answered, and probably require some additional research to be done.

Another question that the figures pose is 'why is the southern birth rate generally higher than the northern birth rate?'

Here, perhaps the answer is easier. The population of the south is younger – only 11% was over 65 (in 2006), against 14% in the north (in 2008). In addition, in the north 23.6% of the population was aged between 45 and 64, whereas in the south this cohort represented only 21.9% of the population. This means that almost 38% of the north's population was over the normal reproductive age, while in the south less than 33% was. Clearly, with more people at reproductive ages in the south there would be more births:

Certainly the higher proportion of the south's population in the fertile 25-44 age group explains a large part of its higher birth rate – but even if births in 2009 in both jurisdictions are expressed as a rate per thousand of the population size in that age group the south appears to be more fertile:

  • South – 1,345,873 people aged 25-44– 77,156 births* = 57.3 per thousand
  • North – 492,721 people aged 25-44 – 24,900 births = 50.5 per thousand

[*2009 Q3 figures multiplied by 4]

A third and slightly more complicated question can also be posed: does the lower northern birth rate imply a lower fertility in the Catholic community in the north than amongst their cousins in the south? Figures for the Total Period Fertility Rate (the hypothetical number of children the 'average woman' will have in her lifetime) for the south for 2009 are not yet available, but in 2008 the TPFR was 2.1 (a slight increase from 2007's 2.0).

In 2009 the TPFR in majority-Catholic areas of Northern Ireland tended also to cluster around 2.1, while in majority-Protestant areas the TPFR tended to be lower (areas not included tend to be fairly closely balanced at child-bearing age):
So, to answer the third question, the evidence seems to imply that (cultural) Catholic fertility is similar north and south, and thus that the lower birth rate in the north may be due to a lower fertility amongst (cultural) Protestants.

Nothing yet answers the first and most puzzling question – why the birth rate in 2009 headed in different directions in the two jurisdictions? Perhaps an answer will become obvious over time, or perhaps 2009 was simply an unexplainable anomaly. This blog will continue to watch these statistics to see if an explanation presents itself.

Thursday 18 March 2010

Births in 2009

NISRA has just released its provisional figures for births in 2009.

The overall number of births, as well as the birth rate (births per 1,000 population) and the TPFR (Total Period Fertility Rate - the average number of children that would be born in a cohort of woman who experienced, throughout their childbearing years, the fertility rates of the calendar year in question) have all turned down again, after a period of increase following the low point of 2000.

As in previous years, the pattern is one of apparently higher birth rates, and a higher TPFR in nationalist areas. The tables blow shows the 26 district council areas ordered according to: (1) their birth rates, and (2) their TPFR.

District councils are coloured green if the child-bearing cohort (average age 29.8 in 2009, thus 21 in 2001) was majority Catholic (by community background (religion or religion brought up in)) in the 2001 census, or orange if that childbearing cohort was majority Protestant in 2001. District council areas where neither community had over 55% of the 21-y.o. in 2001 are left uncoloured.

Birth rates

Of the 'top 10', only one is 'orange', while five are 'green' and four are mixed. In fact, in the top 14 there is still only one 'orange' area! The 'bottom 10' contains six 'orange' areas but only three 'green' ones, and one mixed.

The coefficient of correlation between the birth rate and the percentage of the child-bearing cohort that is Catholic in the 26 districts is a very significant 0.61. The coefficient of correlation between the birth rate and the percentage of the child-bearing cohort that is Protestant is an equally significant minus 0.60.

TPFR

Of the 'top 10', only two are 'orange' areas – four are 'green' and four are mixed. Of the 'bottom 10', six are 'orange', three are 'green' and one is mixed.

Only one 'orange' area has a TPFR above the 'replacement level' (2.10), while 4 'green' (and 4 mixed) areas do.

The coefficient of correlation between the TPFR and the percentage of the child-bearing cohort that is Catholic in the 26 districts is 0.34. The coefficient of correlation between the TPFR and the percentage of the child-bearing cohort that is Protestant is minus 0.33.

Conclusions

Although the figures are not absolutely black-and-white, there is at least statistical evidence that areas that are 'more Catholic' have both a higher birth rate and a higher TPFR than areas that are 'more Protestant'. No real conclusions can be drawn about who, within these areas, are actually having the babies, but it is unlikely if, for example, Newry and Mourne's high birth rate is being sustained by the small (17%) share of its 29 year-olds who are Protestant. Likewise, Carrickfergus's low birth rate cannot be entirely blamed on its tiny Catholic population.

It is not unreasonable to draw the conclusion from these figures, that the overall Catholic birth rate is still higher than the overall Protestant birth rate. Since 50.4% of the 21 year-olds in 2001 were from a Catholic community background (against 46.3% who were from a Protestant community background), it is likely that the proportion of the children born in 2009 into a Catholic community background exceeds the proportion born into a Protestant community background. The size of the Catholic community lead is hard to measure at this stage, but the results of the Schools Census suggest that it could be as high as 10%. The next decennial census (in 2011) will throw more light on this.

Wednesday 3 March 2010

Ebb and Flow

Following on from the recent post about the Schools Census and its consequences for the future, this blog would like to draw attention to a very interesting site on which some key outcomes of the 2001 decennial census are displayed in map form. This blog would also like to thank the creator of the site for permission to publicise it.

The site – http://nireland2001.webs.com/ – contains numerous detailed maps, at the level of province (Ulster), Northern Ireland (six counties), the six counties individually, and all of the main towns. For each area it compares the proportion of the population over 75 years of age to the proportion between 0 and 4 according to Community Background (Religion Or Religion Brought Up In), as recorded in the 2001 Census.

The maps show areas that are majority Protestant (community background) in orange, with the shade deeper or paler according to the strength of the Protestant majority. For areas with a Catholic (community) majority, the same is done but in green. To give a taste of the site, the example of County Antrim is shown below; all the other counties and towns are on the site itself, and are well worth a look [Antrim, Down, Armagh, Fermanagh, Derry, Tyrone]

The information is displayed for each ward, of which there are around 500 in Northern Ireland, and thus allows quite a detailed view of the situation.

Map 1: those over 75 years of age at the time of the 2001 census:


Map 2: those between 0 and 4 years of age at the time of the 2001 census:


Quite a few things stand out in these maps – here are a few examples:
  • Rathlin Island – the rumoured vote for Ian Paisley on Rathlin may have been true, because a majority of those over 75 were Protestant (community). But their grandchildren's generation is over 90% Catholic (community)! However, as the ward includes both Rathlin and Bonamargy on the mainland, it is hard to draw conclusions about the island itself.
  • South East Antrim – deeply orange-coloured amongst the over-75s, but much paler and less homogenous amongst the children.
  • Look at how the green tide is spreading south from the Glens – Carnlough, which is less than 70% Catholic (community) amongst its old people, is over 90% Catholic (community) amongst its children. Glenarm, majority Protestant (community) amongst its old people, is over 50% Catholic (community) amongst its young. Glenravel (in Ballymena Borough) is even more dramatic – its old people are over 50% Protestant (community), but its young people are over 70% Catholic (community).
  • The North-West electoral area of Antrim Borough has only one majority-Catholic (community) ward – Toome – amongst its old people, but four out of the five wards have a Catholic (community) majority amongst its young.
  • Crumlin – as many know – has seen a dramatic change in its religious demographics, as has Rasharkin too.
The same effects can be seen all over Northern Ireland, as the numerous maps on the site show. As a way of visualising the changes that are making themselves felt in Northern Ireland – and that will intensify – the maps are invaluable.

Two maps also show a simple majority-Protestant or majority-Catholic image of Northern Ireland as a whole. The difference between the older people (map 3) and the younger people (map 4) is stark, and is reminiscent of the sea-shore as the tide comes in, flooding the orange sand with green water and leaving ever-smaller orange islands.

Map 3: those over 75 years of age at the time of the 2001 census:

Map 4: those between 0 and 4 years of age at the time of the 2001 census:

Thursday 25 February 2010

Schools Census 2009-2010

Regular readers of this blog will know that the Schools Census is an annual survey of all pupils in Northern Ireland's schools. One of the items of information it gathers is the religion of the pupils. (See previous blogs on the Schools Census: 2007, 2008, 2009)

Like the decennial census, the Schools Census is important in that it provides a glimpse of what the religious breakdown of the future will look like. Today's school children are, of course, tomorrow's voters. Given Northern Ireland's politico-religious divide, it is likely that today's Protestant children are tomorrow's unionist voters, and today's Catholic children are tomorrow's nationalist voters.

This year's Schools Census - published today - adds to a series going back over a decade, and thus permits the trend to be followed, as well as this year's snap-shot.

As in the decennial census, there are large numbers of children whose religion cannot be ascertained, or who genuinely do not have one. In order to estimate how these children may identify in terms of Northern Ireland's 'community' division, this blog has, this year, recalculated all of the results since 1998 using the outcome of the methodology that NISRA applied in the 2001 Census. In other words, the 'None/Not stated' children are 'allocated' to the different options (Catholic, Protestant and Other Christian, Non-Christian, and None) in the same proportions that NISRA allocated children and teenagers in its calculation of 'Table S306: Age By Community Background (Religion Or Religion Brought Up In)'. This was:
  • For children aged 5-11, those who were declared as 'None/Not Stated': 24.3% to 'Catholic', 40.0% to 'Protestant and other Christian', 0.5% to 'Non-Christian, and 35.2% to 'None'.
  • For children aged 12-18, those who were declared as 'None/Not Stated': 25.4% to 'Catholic', 46.5% to 'Protestant and other Christian', 0.5% to 'Non-Christian, and 27.6% to 'None'.
The resulting series is shown in the graph below:

It shows clearly that the proportion of children who are from a Catholic community background is over 50%, and has been over 50% for over a decade. The proportion from a Protestant community background had hovered at around 45% for around a decade.
Since 2005, though, the Protestant proportion of schoolchildren has visibly declined, and now stands at 43.8% (of the adjusted figures. They form only 40.4% of the raw figures!). At primary level the Protestant proportion is lower than at secondary (43.3% against 44.3% of the adjusted figures), showing that the decline is set to continue. The difference between one year's schools census and the next is almost entirely due to the difference between the exit cohort (those who were counted in year N, but no longer in year N+1), and the entry cohort (those too young for school in year N, but in P1 in year N+1). Of the 14 age cohorts counted each year, only two contribute to change, and 12 are counted in the previous and following years. So a visibly declining Protestant share, year on year, implies that the entry cohort is significantly less Protestant than the exit cohort – the difference between two age-cohorts is sufficient to produce a visible effect on the whole 14 age-cohort population.

The conclusion is, of course, that Catholics are more numerous than Protestants at all ages under 18 – and have been for the whole period covered. In fact, children from a Catholic community background form an absolute majority of children, and have since the series began in 1998. More even - Catholic children form a majority even before the figures are adjusted to 'allocate' the unstated.

The consequences for the wider population, and vitally the electorate, are obvious. If Catholics continue to vote overwhelmingly for nationalist parties, then the new voters coming into the electorate have been majority nationalist for quite some time. As they age, they will contribute to the 'greening' of the electorate, unless significant numbers vote for unionist or centre parties. However, despite claims to the contrary by some unionists, there is no evidence of any 'Catholic unionist' vote – or if it exists it is equally matched by a Protestant nationalist vote.

As is so often said, our children are our future. Our children are increasingly Catholic, so what does that say about our future?

Wednesday 17 February 2010

Reducing impetus towards Catholic emigration

One of the principal components of demographic change in any society is migration. Unlike the other components, though, it rarely follows long-term trends. Numbers of births and deaths tend not to change very much from one year to the next, and a graph of them over a period tends to be a fairly smooth curve. Migration, though, is often only seen after it happens, and is difficult to predict.

Nonetheless, in a stable society certain drivers of migration can give rise to fairly continuous in- or out-flows of people. Unemployment often leads to outflows, and job opportunities often lead to inflows.

For many years Northern Ireland's unionist ruling elite (political, economic, and cultural) relied on emigration as a way of negating the higher Catholic birth rate. So for decades after the foundation of Northern Ireland as a state, despite higher Catholic birth rates than Protestant birth rates, the proportion of Catholics in the population did not change significantly. The 'excess' Catholics were simply 'encouraged' to emigrate in order to find work – and emigrate they did, in large numbers.

The lack of job opportunities for Catholics in Northern Ireland – due to blatant discrimination against them by Protestant employers – led to a considerably higher unemployment rate for Catholics, and a lower rate of labour force participation. Faced with such a bleak prospect, many young Catholics emigrated.

However, in recent years – partly due to equality laws, and partly due to the generally higher level of education amongst young Catholics than amongst young Protestants – the rate of Catholic unemployment has been dropping, and in many areas is not significantly higher than Protestant unemployment.

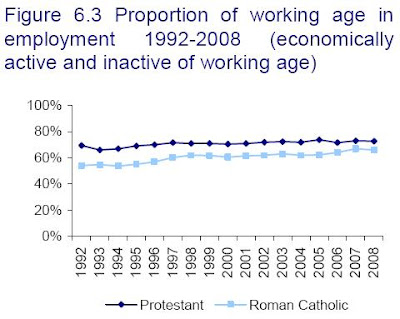
The 2008 Labour Force Survey Religion Report provides copious statistics on the position of Catholics and Protestants in the labour market, including the graph below:

Although Catholics are still more likely to be unemployed than Protestants, the difference has dropped dramatically since 1992.

Likewise, the prospects of employment for Catholics have almost caught up with those for Protestants:

There is still work to do, but the evolution in the labour market is clearly towards more equality, which in turn will reduce the impetus towards emigration for Catholics. And if Catholics do not emigrate, then the old unionist safety valve is no longer functioning – and with more Catholics amongst the children and young people of Northern Ireland, that can only mean one thing – in the long-term there will be a Catholic majority. As the 2008 Labour Force Survey Religion Report (section 2.4) puts it:

[Population aged 16-24] The proportion of Protestants was 49% in 1990 and 44% in 2008. The proportion of Roman Catholics was 44% in 1990 and 49% in 2008.
In a few days this blog will look again at the breakdown amongst school-children, but it seems that at all ages below around 30 there is a Catholic majority. Over the age of 60, on the other hand the LFS Religion Report reminds us that:

The proportion of Protestants was 66% in 1990 and 63% in 2008. The proportion of Roman Catholics was 30% in 1990 and 32% in 2008.

Time is running out for Protestant 'Ulster'.

Thursday 4 February 2010

Electoral apathy, young people and unionists


Evidence shows that older people are more likely to vote than young people. In the 2007 Assembly election research shows that turnout was highest among those aged 55 and over (79%) but fell to 40% of those aged 18-24 years old and to 54% among 25-34 year-olds.

This clearly has some consequences for the votes received by the two main political blocks in Northern Ireland, because the older cohorts are more Protestant (and thus unionist) than the younger, more Catholic (and thus more nationalist) cohorts.

At the time of the 2001 Census, 64.9% of those aged 55 and over were from the Protestant community (Census table s306, Religion or Religion brought up in), whereas only 34.1% were from the Catholic community. However, at the younger ages the balance was different; of those aged 25-34 the Protestant community percentage was 51.2% against 45.3% for the Catholic community, and at ages 18-24 the Protestant community had dropped to 46.5%, while the Catholic community was now in the majority, at 50.1%.

So the Protestant community (and thus unionism) enjoys an 'age advantage' in the electorate. They form a greater proportion of the higher-turnout group.

One of the reasons why older people have a higher turnout is that they are more likely to be registered. Research done by PricewaterhouseCooper for the Electoral Commission shows that older people are more likely to be registered to vote in the first place.

The research looked at the electoral register in December 2007, and found that significantly higher proportions of people in oder cohorts were registered than in younger cohorts:


The corollary, of course, was that the un-registered were over-represented amongst younger people:


In most Westminster constituencies the rate of registration for those aged 60+ was over 90%, while the rate of registration of those aged 18-19 ranged from 25% in South Belfast to 80% in Fermanagh and South Tyrone – with an average of 59%. The second most common reason given for not voting in the 2007 Assembly elections was 'I wasn't registered to vote' – a reason given by 16% of all non-voters.

So even if parties manage to enthuse their community bases coming up to an election, those who are not registered still cannot vote. And since they are disproportionately young they are also disproportionately Catholic and nationalist.

The research showed that around 10-11% of potential voters are un-registered, but these do not have the same community profile as the electorate. Because younger people are more often un-registered, the age profile of the total registered population is skewed in favour of the older age-groups. While people aged 60+ were 25.2% of the entire population (over 18), they comprised 28.0% of the registered voters. Likewise, those aged 45-59 were 24.9% of the potential voters, but 25.5% of the registered voters.

So unionism has a double age advantage. Its has an advantage is the group that is both more registered, and turns out more.

Yet, curiously, its 'community vote' – i.e. the combined unionist vote in 2007 – was lower than its share of the electorate, rather than higher, as logic would seem to imply. In 2001 unionism's potential electorate (all Protestant and Other Christian (including Christian related)) amounted to 56.2% of the electorate, but the proportion of the vote in 2007 that went to unionist candidates was 48.7%. Even if a generous proportion of the Alliance score (5.2%) and the 'others' (3.6%) is added to the unionist total, it does not reach the figure that unionism would expect even if turnout rates were standard across all ages.

Nationalism, with a standardised turnout rate, could expect to equal the 41.5% of the Catholic community (according to the 2001 Census) – yet the nationalist vote was 42.6% of the total.

If allowance is made for the age-specific registration rates and age-specific turnout rates then unionism ought to have been able to achieve over 58% of the vote, while nationalism would struggle to reach 41%.

So what happened?

Constituencies that are overwhelmingly unionist did tend to have a low turnout rate in 2007: East Belfast 59.2%, East Antrim 52.7%, Lagan Valley 59.2%, North Down 53.0%, Strangford 53.6%. It seems that while there is a measured age-specific difference in turnout, nobody has dared to ask whether there is a clear community-specific difference in turn-out. It seems that the high turnout rates amongst old people are masking an even higher turnout rate amongst older nationalists, and the low turnout rates amongst young people are masking an even lower turnout rate amongst young unionists.

The implications are that more unionists than nationalists find politics a turn-off, or do not consider than the available choice represents their views. The two most common reasons for not voting in 2007 (apart from not being registered) were: 'I'm not interested in politics' (29%) and 'Can't trust politicians to keep their promises' (13%). 'No point in voting as it was obvious who would win' – an obvious reason in majority unionist areas, was in fact cited by only 6% of the non-voters.

So it seems that the strength of feeling for unionism, and for unionist candidates, is not as high as many would like to think. The image of unionism as monolithic, with its supporters implacably opposed to any change in the status quo, may be wrong. The view that Protestants could be counted on to vote en masse for a unionist outcome, either in an election or in a referendum, may also be wrong. On the contrary, it seems to be nationalists who are more determined to achieve their objectives through the ballot box. And as their numbers at the ballot box increase, they may achieve electoral superiority even before they achieve numerical superiority.

For all the tough talking of unionist politicians and the unionist media, it seems that the ordinary Protestant in the street is simply not as interested in unionism as previously thought.

Thursday 21 January 2010

Goodbye Scotland

A funny thing happened around the turn of the millennium. The flow of people between Northern Ireland and Scotland also turned. Back as far as the statistics are available (1991) the flow had been in Scotland's favour – more Northern Irish people moved to Scotland than the reverse. But in 2000 that changed, and Northern Ireland's ebb became a flow. In every quarter since 2000 Q2 more people have moved from Scotland to Northern Ireland than have moved from Scotland to Northern Ireland:


What could have caused this reversal of the flow? It would be nice to think that the Good Friday Agreement led many Northern Irish émigrés to return, but this is unlikely. People move for economic reasons, and rarely for ideological reasons.

Perhaps Scotland had become an unattractive place – economically and socially – following its devolution? This is also unlikely, as migratory flows between Scotland and England and Wales are very much in Scotland's favour. Over the period from 1991 to 2009 Scotland gained a net 320,000 people from England and Wales, but gained barely 800 from Northern Ireland.


So why are Northern Irish people no longer emigrating to Scotland in the same numbers?

Changes in funding arrangements for third-level education could be playing a part. Up-front tuition fees were abolished in Scotland in 2000 – but only for Scottish-domiciled students. Those from elsewhere in the UK had to pay fees (though, ironically, students from outside the UK, including the south of Ireland, were treated as 'local' students and paid no fees). This had the effect of encouraging Scottish students to stay in Scotland. The increased cost of going to university may have led more students to stay at home in Northern Ireland, thus greatly reducing the outflow to Scotland. With a reduced outflow, perhaps the underlying inflow from Scotland came to the surface. This still does not explain why there is an underlying positive inflow though. Some may be Northern Irish students returning after graduation, but who are the rest?

It will be interesting to see if this pattern continues, and if it does, whether it has any effect on Northern Ireland's increasingly close community balance. Scottish migrants could, after all, be either unionist-minded like Ian Paisley's parents, republican-minded like Pat Doherty MP MLA, or socialist like James Connolly.

Monday 18 January 2010

Equality Commission Monitoring Report for 2008

Every year the Equality Commission publishes a Monitoring Report on the Northern Ireland workforce showing the proportions of Protestants and Catholics employed in most major public and private sector organisations. For 2008, Monitoring Report N° 19 was published on 8 December 2009.

The Monitoring Report looks at the 'monitored workforce', which comprises all public sector employers and private sector concerns with 11 or more employees. It thereby included, in 2008, 529,857 employees (of whom 447,654 full-time, and 82,203 part-time).

The Report contains a wealth of fascinating detail about the composition and evolution of the Northern Irish workforce in terms of community background. The Report breaks down its data by community background, gender, full or part-time nature, Standard Occupational categories, public or private employment, and so on. The quantity of data contained in the Report is too great to discuss fully in a single blog entry, so this blog will limit itself to a number of key details:

Overall, for all employees (full or part-time)
- The total monitored workforce now stands at 529,857 employees, a rise of 0.7% or 3,646 since 2007.
- In 2008, the overall composition of those for whom a community could be determined was 54.8% Protestant and 45.2% Catholic.
- Total Protestant employment fell by 1,808 (0.7%) during the year, while the Catholic count increased by 4,495 (2.1%). As a result, the Catholic share rose from 44.6% to 45.2%.

In the private sector, for all employees (full or part-time)
- The total private sector workforce now stands at 339,904 employees, an increase of 5,712 employees (1.7%) since 2007.
- The composition was 54.8% Protestant and 45.2% Catholic.
- Total Catholic private sector employment increased by 3,846 employees (2.8%) during the year, while the Protestant count grew by 644 (0.4%). As a result, the Protestant share of the private sector fell from 55.4% in 2007 to 54.8% in 2008.

And in the public sector, for all employees (full or part-time)
- The total public sector workforce now stands at 189,953 employees, a fall of 2,066 employees (1.1%) since 2007.
- The composition was 54.6% Protestant and 45.4% Catholic.
-Total Protestant public sector employment fell by 2.4% or 2,452 employees during the year, while the Catholic count increased by 649 (0.8%). As a result, the Catholic share of the public sector rose from 44.6% in 2007 to 45.4% in 2008.


Within these totals there can be more mixed figures – for example, while the overall Protestant share in the private sector dropped, the Protestant share amongst part-timers in the private sector rose slightly. But the overall picture remains one of Catholic advance and Protestant retreat.

Some of the clearest and most striking sections are the graphs that show the evolution over the period from 2001 to 2008. For example, the evolution of the entire monitored workforce over the period:


The graph above, showing the evolution of the whole monitored workforce, clearly shows that Catholics are steadily increasing their share of the workforce. The graph below shows how this is happening. As a proportion of job applicants, Catholics have now caught up with Protestants:


This reflects the increasing proportion of Northern Ireland's young people who are from the Catholic community. In addition to those shown in the graph above, the community background of another 15% of applicants was 'non-determined'. No assumptions can be made about these people, of course, but given the generations of discrimination that Catholics have endured, it would not be unlikely that Catholic applicants would disguise their community origins more often than Protestant applicants.

2008 was, of course, an unusual year, with the economic crisis starting to affect the workforce and in particular the numbers of jobs available and the numbers of applicants for these. Yet the numbers in the monitored workforce actually increased overall in 2008, and the workforce peaked in October 2008. The Monitoring Report for 2009 – to be published in December 2010 – will provide an interesting insight into how the recession has influenced the community breakdown of Northern Ireland's workforce. However, even if the recession causes some unusual figures, the evolution over the long-term seems to be constant and consistent with a growing Catholic share of the population. As Protestants form a large majority of those at older ages, especially those coming to retirement age, the 'greening' of the workforce is due to continue for the foreseeable future.

Tuesday 1 December 2009

2008 Annual Report of the Registrar General

The 2008 Annual Report of the Registrar General was published yesterday by NISRA. As usual, it is a valuable compendium of statistics on the demographic situation of Northern Ireland.

As far as the community balance is concerned, the report offers relatively little. Only in two areas can a hint be extracted as to the likely direction of Northern Ireland's ethno-political future.

On the religious breakdown of marriages, the previously observed pattern remains visible. The proportion of marriages celebrated in 'Protestant and other' churches continues to decline, while the proportion of marriages celebrated in Catholic churches remains stable. The Catholic proportion, which overtook the Protestant proportion about 10 years ago, is clearly widening its lead:


As previously noted in this blog the large number of civil marriages makes any firm conclusions difficult. But as an indicator of trends, the graph above tends to show that the proportion of marriage-age young people (around 30 years of age) that is Catholic is greater than the proportion that is Protestant, and that gap is widening. Many of the civil ceremonies are to older – often divorced – people, and are thus less likely to lead to children. Hence the proportion of marriages celebrated in the two main religious groups may well indicate the proportion of births attributable to these groups in the years following the marriages.

The second hint that can be extracted is related to those births. There are 13 local government districts whose birth rate exceeds or equals the average. Several of those are in the Greater Belfast commuter area, and thus are areas in which young families (of both religions) tend to set up home: Lisburn, Antrim, Newtownabbey, Banbridge, Craigavon. But all of the other 'above average' districts are Catholic-majority districts: Cookstown, Magherafelt, Dungannon, Newry and Mourne, Derry, Strabane – or are areas in which Catholics form a majority amongst the child-bearing cohort (ages 20-40): Armagh (where at all ages below 36 (in 2009) Catholics outnumber Protestants), and Belfast (where Catholics outnumber Protestants at almost all ages in the child-bearing cohort). The conclusion that can be drawn from these figures is that Catholics are still having more children than Protestants.


The areas that are largely Protestant – Ards, Larne, Carrickfergus, North Down, Castlereagh, Coleraine, Ballymena – have birth rates below the average.

On deaths, the areas with death rates above the average are all majority-Protestant, with the exception of little Moyle. Belfast has an above-average death rate, but its old people are largely Protestant (unlike its young - see above). The inescapable conclusion is that deaths are disproportionately Protestant.

Put the two effects together: more Catholic births, more Protestant deaths – and the picture becomes clearer. Over time, there are proportionately more Catholics – and thus, in all likelihood, more nationalists – and fewer Protestants, and thus fewer unionists.

Thursday 19 November 2009

Please don't label me

The British Humanist Association is carrying out a billboard campaign to coincide with Universal Children's Day tomorrow, 20 November – the United Nations 'day of worldwide fraternity and understanding between children'. "Labelling children as if they innately "belong" to a particular religion, while ascribing incompatible beliefs to infants who "belong" to other religions, can only serve as an obstacle to understanding between children around the world" according to the humanists.

The poster can be seen on Great Victoria Street in Belfast, or for the rest of us, here:


Of course in Northern Ireland children (and even sheep) are routinely labelled as belonging to one religion or the other. The labels are tribal rather than religious, though. Few if any children have any idea what religion really is – and usually the adults doing the labelling are themselves hypocrites. Northern Ireland's religions are badges of ethno-political identity, and only a minority of adults actually adhere to the tenets of their so-called beliefs.

Nonetheless, it seems as if the humanists are a bit late to the game. Even at the time of the 2001 census many parents were declining to label their children. Look, for example at the graph below. It shows the percentage at each age group that were declared as belonging to one of the 'big three' religious groups in Northern Ireland – Catholic, 'Protestant/other Christian', and 'No religion/religion not stated' (Census table s306a). Apart from the obvious observation, that Catholics are more numerous than Protestants below the age of 27, another element stands out clearly – that below the age of 10 the proportion that are 'not labelled' increases dramatically.


Now those kids below 10 did not fill in their census forms themselves, so it is obvious that their parents are deliberately not labelling them – despite labelling themselves (look at the proportion of 'none/not stated' in the age group of the parents, i.e. between 30 and 45).

So a lot of parents in Northern Ireland – up to 25% - already did not label their kids in 2001. By 2009 this proportion has probably increased even further. Only when the results of the next census are released in about four years will we be able to see whether the unlabelled in 2001 grew up and gave themselves tribal labels, or if the trend seen in 2001 was really the start of a post-religious society.

Wednesday 4 November 2009

Electoral registration

The Report of the Chief Electoral Officer for Northern Ireland for 2008-2009 (bizarrely the Electoral Office year runs from 1 April to 31 March) was published on 29 October.

Though largely dealing with administrative matters, it also contains some nuggets of information that are relevant to the future 'community' shape of the electorate, and thus probably the voters too.

For example:

"The new register published on 1 December 2008 showed a net increase of 16,568 in the electorate compared with the register published on 3 December 2007. By 31 March 2009 there had been a further net increase of 11,681 individuals, largely due to the “Schools Initiative” […] bringing the total electorate to 1,154,228."

So, over a 16 month period 28,249 new voters were added to the register – the majority of them probably young people reaching the age of 18. And we know that the majority of these people are Catholic by community identification.

At the same time the Report notes that:
"During the year 11,818 deceased persons were removed from the electoral register."
And we also know that these deceased persons were likely to have been 65% Protestant and 35% Catholic by community identification.

Taking the two figures together, it is therefore likely that 21,187 young people are added to the register every year (the 28,249 cited above was for 16 months, bear in mind), and 11,818 deceased persons drop out of the register.

The 21,187 young people break down as 11,229 'Catholic community' and 9,958 'Protestant community' (ignoring for the purposes of simplicity the fact that some on both sides are irreligious or atheist, and assuming a 53%/47% split). The old people break down as 7,682 'Protestant community' and 4,136 'Catholic community'.

So the 'Protestant community' gains 2,276 net new potential voters. The 'Catholic community' gains 7,093 net new potential voters. This translates into a relative increase of 4,816 in the 'Catholic community' electorate every year.

Of course not all electors vote – generally the turn-out rate is around 62% (61.9% in 2007, 61.6% in the local elections in 2005, 62.9% in the 2005 Westminster election). So every year the relative increase in Catholic community voters should be around 3,000. But since old people have a higher turn-out rate than the young, the real loss to the 'Protestant community' may be higher. If the turn-out rate of old people is 80%, and that of young people is 50%, the 'Protestant community' actually loses voters, at a rate of 1,166 every year, while the 'Catholic community' gains 2,306 – giving a net advantage of 3,472 per year to the 'Catholic community':

Needless to say, these figures are just statistical calculations – there are a number of variables that they cannot take into account: changes in turn-out rates, emigration of young people (including the 'Protestant brain drain'), immigrants, and so on. And of course, nominal religions may not always correspond precisely with political preference. However, in most cases the evidence points to a very close correlation between religion and politics.

If the correlation remains close, we can estimate that the net gain to nationalism per year is in the region of 3,000 to 3,500. Unionism was ahead of nationalism by 42,000 in 2007 – if it is losing 3,500 of that lead every year it has barely 12 years left before it is overtaken. Even if the lower estimate (3,000) is used, the time left to unionism is only 14 years.

Project Ulster is into its last generation – the sooner unionism realises it and starts to negotiate a future for itself within a re-united Ireland, the better its future. Refusing to acknowledge the elephant in the living room will leave unionism in a weak position in 12 or 14 years!

Thursday 10 September 2009

Fertility rates by Council area

Over the past few years Northern Ireland's birth rate, and the absolute number of births, have increased after a period of decline. Of interest to political demographers is the nature of these births, and how they can throw some light onto the current and future political shape of the region.

For the purposes of births and fertility rates, Northern Ireland's 26 District Councils can be roughly divided into three groups: those where the births are mainly to Protestant mothers, those where the births are mainly to Catholic mothers, and those that are more evenly balanced.

In the first (majority Protestant) group are: Ards, Castlereagh, North Down, Ballymena, Ballymoney, Carrickfergus, Coleraine, Larne, Newtownabbey and Banbridge.

The second category (majority Catholic) includes: Down, Cookstown, Magherafelt, Moyle, Dungannon, Newry and Mourne, Fermanagh, Limavady, Derry, Omagh and Strabane.

The third group includes: Belfast, Lisburn, Antrim, Craigavon and Armagh.

The inclusion of some of these districts in their categories may appear surprising to those who know the political breakdowns of the areas, but a predominance of one or other political community may mask a much more even balance at younger ages. In Antrim Borough, for example, the unionist majority at voting age masks a virtually 50/50 split between Catholics and Protestants amongst the children. In Lisburn, although nationalists make up barely a quarter of voters, their children make up over 41% of the total. In Craigavon where nationalists comprise under 40% of the total voters, Catholic children are in a majority, and in Armagh where the two political blocks are very close in size, Catholic children are, again, in the majority. Some districts that appear only weakly nationalist at voting level are strongly Catholic in the playgrounds: Fermanagh is 55% nationalist, but the kids are over 60% Catholic.

NISRA have published tables showing the Total Period Fertility Rates (TPFR) for each district council area for the period 2000-2007. In order to simplify the presentation of the data in this blog (Note: NISRA do not categorise the areas in this way), the 26 councils have been grouped into the three categories above, and the average TPFRs of each category graphed for the years in question. This provides us with a very rough (and entirely unscientific) means of estimating the TPFRs for the two religious blocks:


What is immediately clear is that the 'Catholic' TPFR (i.e. the average of the TPFRs for the 11 majority-Catholic districts) remains higher than the 'Protestant' TPFR. The TPFR of the 'mixed' areas has risen to equal that of the 'Catholic' areas, but several of these 'mixed' areas are booming commuter areas within the Greater Belfast area, with many young families and thus a higher than average TPFR anyway. At least half of the births are, in any case, to Catholic mothers.

So while the gap between the Protestant TPFR and the Catholic TPFR appears to be narrowing, the Catholic rate still remains higher, and may continue to do so for some time. As each year passes, of course, a higher proportion of the child-bearing cohort is Catholic, and this combines with the higher Catholic fertility rate to multiply the effect. In simplistic terms, there are more Catholic mothers each year, and each of them will have more children than their Protestant sisters. In the long-term this will ensure that the Catholic proportion of births continues to increase, and the Protestant proportion to decline. The current Catholic majority at all ages below 30 will strengthen, and as these young people move into the electorate the nationalist (or at least non-unionist) vote should continue to grow. There is no evidence in the birth statistics that the growth of the Catholic electorate will cease or reverse in the next generation – and by then, of course, Catholics will form a majority of the electorate. As long as the current close identification of religion with political preference continues, this will ensure that the future will most definitely not be orange!

Wednesday 2 September 2009

Migration questions

NISRA has recently published a set of excellent reports dealing with the complex issue of migration into and out of Northern Ireland, including a statistical report on Population and Migration Estimates Northern Ireland (2008), and a report on the Long-term International Migration Estimates for Northern Ireland (2007-8).

Taken together both reports provide a wealth of data on this 'missing' component in the evolution of the population. Of course, as NISRA say: "Measuring migration is challenging", and many questions remain unanswered, including (critically for this blog) the political opinions of the migrants.

Both incoming and outgoing migrants comprise two distinct groups – those from 'third countries' (i.e. outside of the UK or Ireland) and those migrating to or from Great Britain. The 'third country' migrants are largely from the new EU Member States, and increased dramatically after 2004. The reports deal with the period up to 2008, so the effects of the current recession are, as yet, unknown. Between mid-2007 and mid-2008 there was a net in-migration of 'third country' migrants of around 4,400, which comprised in-migration of 15,400 and out-migration of 11,000. It is easy to see how the recession might tip the balance in the opposite direction, but we will have to wait for any evidence to emerge.

Migration to and from Great Britain gave Northern Ireland a net gain of 1,400 during the 2007-2008 period, but it is hard to know who these people may be. They may be English, Scottish or Welsh people moving to live in Northern Ireland (and thereby helping to cement Northern Ireland into the UK, unionists might hope) or they could be returning Northern Irish people who have chosen to live in their own country rather than a Britain that they like less (and thus dissolving some bonds between NI and the UK, nationalists might hope). They might be former students who had left NI to study in Britain, and their return might herald the reversal of the Protestant 'brain drain' (as the UUP at least might hope), or they might be predominantly made up of lowly educated Catholics who had been pushed into emigration by the high Catholic unemployment of the 1980s, and who might return fired with determination that this time Northern Ireland will give them what they deserve. As NISRA say in the report on Long-term International Migration Estimates: "Over the last five years population migration has become a prominent feature within public and political debate in Northern Ireland. This debate has created significant interest in and demand for migration statistics."

Ultimately, of course, even the best statistics on migration patterns cannot tell us much about the political future of Northern Ireland. Will the children of Polish Catholics become Irish nationalists? Just because most of the earlier Italian immigrants did does not mean that the same thing will happen. But will they become unionists either? Will they vote at all? Will they stay? Are migrants from the south (of Ireland) automatically nationalists? Perhaps, but perhaps there are also Protestants fleeing the 'papist state' of unionist fantasy? Are migrants from England really 'English' or are they the children of proud Irish nationalists who, despite a Leeds or a London accent, will identify with the nationalist side of Northern Irish politics.

These questions and many, many more will not be answered by NISRA. Only the electoral process will answer them, and only in the longer term. If the vote of one or other political block rises by more than its 'natural increase' (taken to be the increase of its religious support base) then we could start to assume that the migrants are contributing to that growth. But even here there are other factors that will muddy the waters – turn-out rates, intra-block rivalries, and so on.

Both blocks will, no doubt, have noticed the migration figures for the post-2004 period and will be developing strategies to attract the migrants to their cause. So far neither block has appeared to have succeeded, and if the recession leads to the return of net emigration then perhaps the parties will forget about the incomers again – unionists will return to fretting about the disappearance of their young people, and nationalist will return to fretting about their birth rate. This would be a shame, as the need to appeal to newcomers would oblige both blocks to re-evaluate themselves and to take cognisance of their strengths and weaknesses, which could only help to improve the extremely poor quality of local political discourse.

Thursday 23 July 2009

The twilight of the unionist plurality

Observant readers of the recent blog The 2008 balance sheet will have noticed two things:

Firstly, the rate of change due to deaths may be slightly slowing down. In 2007 the proportion of the deaths that were probably (statistically) Protestant was 65%, whereas in 2008 the proportion was 63% - slightly less. This is, of course, entirely natural –in each younger cohort the proportion that is Catholic increases, so over time as these cohorts reach the end of the road the proportion of deaths that will be Catholic will increase. The 'tipping point' in the 2001 census was around age 24 (thus at age 32 today). This means that at ages older than that a majority (or more correctly, a 'plurality') is Protestant, but at all ages below it the majority is Catholic. However, since the 'tipping point' is so far below the average life expectancy, a majority of deaths will be Protestant for at least another 40 years – though as the tipping point gets closer to average life expectancy, the deaths will converge.

Secondly, although the blog presented a snapshot for one year – 2008 – there is no statistical reason for it not to be extended another half-generation into the future. We have the statistics necessary to calculate the natural changes in the electorate for several years to come, because the entrants and exiters are already known to us. The entrants are the children currently below 18 years old, and thanks to the 2001 census we have a reasonable idea of the breakdown of those now aged 8 to 18 (those below 8 were not yet born in 2001). We know even more about the exiters, because they were more likely to express a religious affiliation than the children. If we assume that the death rate will continue more or less unchanged for another generation, then we can work out, on a year-by-year basis, how many Catholics and Protestants will die – and thus how many potential voters the unionist and nationalist blocks will lose.

The result of this (repeat: purely statistical) exercise is as follows:

In the period up to 2019 (as far as we can see with the results of the 2001 census), the 'Catholic cultural community' will gain 143,424 new voters, as the children reach 18. The 'Protestant cultural community' will gain 128,651 new voters. But, over the same period of time, if current death rates hold, the 'Catholic cultural community' will lose 63,909 voters through death, while the 'Protestant cultural community' will lose 110,251.

This gives a net gain of 79,515 to the 'Catholic cultural community', and a net gain of 18,400 to the 'Protestant cultural community'.


Not all potential voters actually vote, of course, as we know. But the older ones are more likely to vote than the young, which exacerbates unionism's difficulty. Because the 110,251 Protestant deaths probably represent 88,201 actual voters (assuming an 80% turnout rate for the elderly)! Factoring in the 50% turnout rate of the young, and the 80% turnout rate of the elderly, we see that unionism is likely to lose 23,875 actual votes by 2019, while nationalism may gain 20,585 actual votes – a net gain by nationalism of over 44,000 actual votes.


But in the 2007 Assembly election unionism's lead over nationalism was a mere 42,121 votes. So, some time before 2019 unionism is going to lose its plurality of the vote. No wonder some of its more foresightful members are trying to find a way to recruit Catholics.

This analysis does not include migration, which may play a role as well. We have seen (as has unionism!) that young Protestants are more likely to go to university in Britain than young Catholics, and once there they are more likely to stay there. So this would have the effect of removing a small additional number of potential unionist voters. Whether non-university migration might counteract (or reinforce) this trend we cannot yet see, but clearly unionism is worried, and with very good reason.

Another unfactored element is the increasing propensity of young voters to vote as they get older. An 18 year old may have only a 50% likelihood of voting, but that same individual a few years later is more likely to vote. As the younger cohort is majority-Catholic this factor may add slightly to the nationalist vote as time goes on.

We are living through the twilight of the unionist plurality. What follows it will be a period of double-minority, when neither unionism nor nationalism has a majority of either votes or seats, and the 'centre parties' will come into their own. But beyond that time should come a 'dawn', when nationalism finally achieves a majority in Northern Ireland. Of course, a week is a long time in politics, and this dawn will be almost a generation away, so all manner of things could change. Except, of course, the inexorable demographic decline of Northern Ireland's Protestant population – unionism's historic constituency.

Monday 20 July 2009

The 2008 balance sheet

As last year (Part 1 and Part 2), this blog will examine the changes in the sizes of the two main religious blocks (Protestant and Catholic) during 2008 in order to get some idea of the changes in the relative sizes of the two main political blocks (unionist and nationalist).
Since we do not have any reliable statistics on migration, we are left with only the other components of the 'natural' evolution of the population to look at: births and deaths. In the context of politics, of course, a voter is 'born' at chronological age 18!

Deaths

NISRA published their Press Notice on Deaths in Northern Ireland in 2008 in March, which provides the actual number of deaths for each age band (in Table 3). Combining this with the results of the 2001 Census (Table S306: Age By Sex And Community Background (Religion Or Religion Brought Up In)), and moving the 2001 cohorts forward to more closely match their actual ages in 2008, it is possible to estimate the religious (and thus political) affiliations of the deceased people, and thereby to estimate the relative losses for each of the main political blocks.

The result is as follows. Of the 14,907 deaths in 2008, around 5,321 are likely to have been Catholic, 9,388 Protestant, and 198 'other' or no religion. From a political perspective, of course, only voters matter, so if we take only those of voting age, around 5,186 were Catholic, 9,270 Protestant, and 176 'other' or no religion. So, in the course of the single year 2008 unionism lost 4,067 more potential votes than nationalism through death.

In the 2007 Assembly elections unionism won 335,888 votes (48.7% of the total), to nationalism's 293,767 (42.6% of the total). The gap between the two main blocks was therefore 42,121 votes. In the 2007 Assembly election the turn-out was only 61.9%, so the 4,067 potential votes would normally represent only 2,518 actual votes (61.9% x 4,067). However, older people have a higher than average turnout rate, and thus the real losses to the two blocks through death is actually higher. There are a number of studies that show that older people are very likely to vote (in the order of 85%), while younger people have turnout rates of barely over 50%. So, out of the loss of 4,067 potential voters due to deaths the actual net loss to unionism may have been 3,254 actual votes, or 7.7% of its 2007 advantage. If the evolution of the electorate was dependent on deaths alone, unionism's lead would be cut to zero within 13 years!

But there is another factor - the new voters that the two main political blocks can expect to gain as voters reach their 18th birthdays.

New voters

This is a fairly easy calculation, as the people who turned 18 in 2008 will largely be those who were 11 in 2001, when the Census recorded their religions (in Table S306: Age By Sex And Community Background (Religion Or Religion Brought Up In)). Migration may also play a small part, but since 18 year-olds who move (to university, for instance) tend to remain registered at their home address, if they vote at all, it is likely to be in the same place that they lived as children. The religious break-down of 11 year-olds in 2001 was as follows: Catholic – 12,902 (49.7%), Protestant – 11,904 (45.8%), other religion or none – 1,157 (4.5%).

So around 25,963 new voters came of age in 2008. For 1,157 of them no real conclusions can be drawn, but for the vast majority this blog's working hypothesis (reminder: that (constitutional) political preferences in the north of Ireland are very closely related to religious affiliation) tends to indicate a net gain for nationalism of 998 potential voters (though remember their low turn-out rate). If we combine these figures with those for deaths, we can calculate a rough balance sheet for 2008, taking the votes in the 2007 Assembly election, adding the new voters and subtracting the deaths. Allowance is made for the different turnout rates of younger and older people. While no data on this has been published specifically for Northern Ireland - a very politicised society - evidence from Britain shows that youthful disaffection is massive. This analysis will take this into account by estimating a conservative turnout rate of 80% for the older voters, and 50% for new voters.

Outcome

The calculations below include the balance sheets for 2007, as calculated last year (Part 1 and Part 2):

(1) Nationalism
2007 Assembly election: 293,767 (42.6% of the total)

2007 gains - New voters: 13,352 x 50% = 6,676
2007 losses - Deaths (voting age only): 4,874 x 80% = 3,899

2008 gains - New voters: 12,902 x 50% = 6,451
2008 losses - Deaths (voting age only): 5,321 x 80% = 4,257

New total: 298,738

(2) Unionism
2007 Assembly election: 335,888 votes (48.7% of the total)

2007 gains - New voters: 11,941 x 50% = 5,970
2007 losses - Deaths (voting age only): 9,517 x 80% = 7,614

2008 gains - New voters: 11,904 x 50% = 5,952
2008 losses - Deaths (voting age only): 9,388 x 80% = 7,510

New total: 332,686

(3) Others or no religion
2007 Assembly election: 60,658 votes (8.8% of the total)

2007 gains - New voters: 1,110 x 50% = 555
2007 losses - Deaths (voting age only): 145 x 80% = 116

2008 gains - New voters: 1,157 x 50% = 579
2008 losses - Deaths (voting age only): 176 x 80% = 141

New total: 61,535

At the end of 2008, therefore, we might have expected a voting electorate of 692,959, of whom: 298,738 will vote nationalist (43.1%), 332,686 will vote unionist (48.0%), and 61,535 will vote for other candidates (8.8%).

The gap between nationalism and unionism, 42,121 votes in the 2007 Assembly election, would be reduced to 33,948, representing a reduction in this gap of 8,173. In only two years, therefore, unionism would have lost over 19% of its numerical superiority over nationalism.

2009, of course, allowed us an opportunity to test these assumptions, but in the European Parliament election the turn-out was disappointingly low, making any comparisons with 2007 unsafe. Nonetheless, it was instructive to notice that the percentages that voted for the three blocks were very similar to those calculated above (unionist 49.0%, nationalist 42.2%, and others 8.8%), and the gap between the unionist and nationalist totals was 32,763.

Conclusion

Last year we estimated that unionism had less than 10 years of numerical superiority left. The updating of the statistics to include 2008 shows that this estimate still stands, but since one of those years has now passed, unionism probably only has nine years left before it is equalled or overtaken by nationalism. This is a purely statistical calculation and turn-out rates or 'novelties' (like the TUV) may influence the actual outcomes at each election – but in the long run the trend will probably continue, unless one or other block succeeds in attracting votes from its rival politico-ethno-religious group.
